Crime Mapping Application Help
Search Results
Results
How to look at results
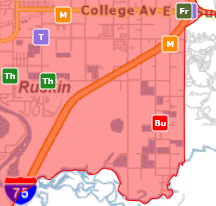
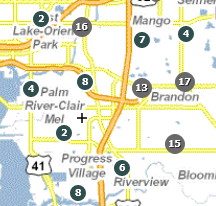
- Results of the search are displayed on the map as points or clusters.
Points:
 Clusters:
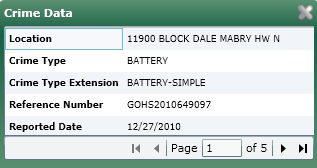
- Hover over a point or a cluster to see it's attributes.

If more than one case exist at the same location, use
 to page through all the cases' attributes.
 - Look at the Chart for a quick reference. Hover over a slice to see the count and percentage of that crime type cases.

The Legend of the Chart acts as a Legend of the crime and traffic data on the map. The Legend contains the number of cases for each individual crime type. Use the circular Chart menu to toggle the chart.
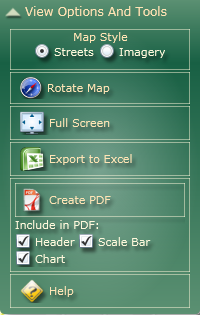
- Use the Export to Excel and Create PDF menus under View Options And Tools menu to save a copy of the records and the map.
